Cloud Benchmarks
For operators sizing a deployment. This page answers how much one database serves, what adding shards and engine replicas does, and what the engine itself costs. Every number was measured, and the configuration that produced it is stated beside it.
The Short Version
What it delivers
- One 32 vCPU PostgreSQL database runs 18,900–24,300 steps/s with the archive on, 1.6–2.1 billion steps a day, at the engine’s shipped defaults and with the database’s checkpoints sized as recommended. The range is the instance: the slower one spent 22% more database CPU per step and took 25% longer per log flush. Check yours (Method Notes).
- Payload is paid in write-ahead log. With 8 KB of JSON per step the same database runs ~10,300 steps/s, with 64 KB ~2,800 (~176 MB/s of payload). Every flush of the log costs about 0.8 ms plus its bytes, so the bytes a step logs set the rate.
- Size the database’s checkpoints. With 8 KB payloads, a 20 GB
max_wal_sizeran 42% more steps/s than the 1.5 GB default. - 32 vCPU is the most economical database size, $0.036–0.047 per million steps at full load. Smaller databases run out of CPU; larger ones are held back by the write-ahead log’s flush, so past 32 vCPU you add shards.
- The engine is cheap. A shard’s work takes about 5 engine cores. Two 8 vCPU engine hosts per 32 vCPU database serve it at about a third of their CPU each, and either can carry it alone.
- Shards add throughput linearly. Four 32 vCPU shards ran 91,800 steps/s, 3.8 times one shard, each shard at close to what one shard runs alone.
- No flow failed in any run. In the 243 runs behind this page, across 40 sessions, no flow errored and no step was left stuck. The engine recovered a crashed worker’s step only in the runs that killed engines on purpose.
- Failover takes about 40 seconds and loses nothing. With every dispatcher killed at once, dispatch paused for ~40 s, standby replicas took over, and every flow completed.
- Replicas add availability, not cost. One, two or four replicas on a shard deliver the same throughput within 6%. Each shard is served by two of them, and any others stand by to take over.
- Long tasks cost no throughput, and mixed durations share one engine. With 8-second tasks the engine delivered the full offered rate, and a mix of 5 ms, 200 ms and 8 s tasks ran at the latency each class predicts. 10,000 concurrent 60-second tasks ran on under one engine core.
- Large state works up to the database column’s limit. 250 MB per step completed cleanly, at ~45 MB/s for one flow and ~135 MB/s for four.
- A day of varied load ran without falling behind. 4.5 hours of mixed shapes, payloads, task durations and priorities, with bursts above capacity, a rolling restart and a database restart: flows completed at the rate they arrived, bursts cost only the lowest priorities a wait, and the live tables levelled off at 10 GB (A Day of Varied Load).
- A growing archive costs nothing measurable. A 32 vCPU database ran saturated until its archive held 100 million step rows, and ran at its empty rate the whole way, while the live tables stayed at ~3 GB. Archived reads took 7–20 ms at every size (Database Volume).
What it means for sizing
- Plan on ~95% of a database’s saturated rate. Offered 95%, a database delivered the full load with a median flow latency of 61 ms and a p99 of 1.1 s; at 100% it kept up, with backlogs of thousands of flows after each dip and twice the p99 (Sustained Load).
- Pair each database with two engines at half its vCPU. 4 vCPU with 2 × 1 vCPU engines runs ~1,850 steps/s,
8 vCPU with 2 × 2 ~4,600, 16 vCPU with 2 × 4 ~8,200, 32 vCPU with 2 × 8 18,900–24,300, and 64 vCPU with 2 × 16
~29,300 at
MaxConnections: 500. - Keep the engine near its database. A step makes about five round trips, so distance costs throughput; the engine opens more connections as distance grows, which recovers most of it out to 1 ms.
- Two small engines per shard deliver a little more than one large engine for several. One 48 vCPU engine ran four 32 vCPU shards at 84,648 steps/s on 23 of its cores, 92% of what eight 8 vCPU engines delivered on the same databases. Garbage collection took 8–10% of the engine’s CPU on every host size, 48 vCPU included.
Sizing a Deployment turns these into a recipe.
How These Numbers Were Measured
| Cloud | Google Cloud, one zone; engine-to-database round trip ~0.06 ms |
| Database | Cloud SQL for PostgreSQL 16, 32 vCPU, 128 GB RAM, 1 TB SSD, default max_connections (1,000), unless a section says otherwise |
| Database settings | From 2026-11-06: max_wal_size 20 GB, checkpoint_timeout 15 min, wal_compression = lz4 (why). Earlier runs: the service’s defaults |
| Archive | From 2026-11-06: on, at the default retention, so each closed flow moves to the archive about a minute after it closes. Earlier runs predate the archive and kept closed flows in the live tables |
| Engine host | c4a-standard-16 (16 vCPU Arm), one replica per host, unless a section says otherwise |
| Engine configuration | Shipped defaults: no pool size, no MaxConnections, no Weight |
| Workload | linear: a 10-step chain of no-op tasks, no payload. It isolates the engine and database cost per step. |
| Load | Saturated: flows are created as fast as the backlog allows, up to 2,000 in flight per shard |
| Window | 2 minutes of warmup, then a 16-minute measurement window; 6 minutes from 2026-11-06, after a 16-minute run on that build held its rate to the end. Throughput is the window mean. |
| Database | A fresh database for every run |
| Outcome | No flow errors in any run |
Steps/s counts task executions. A 10-step flow at 1,000 steps/s is 100 flows/s.
A shard is a separate database server, not a separate database on a shared server: shards share nothing, so each brings its own write capacity (measured below).
Absolute numbers belong to the instance that produced them; ratios travel. Cloud instances of the same spec differ: on one build, two 32 vCPU instances ran 18,852 and ~24,100 steps/s (Method Notes). The runs below span several sessions, engine builds and rig setups, each session on its own set of instances. A comparison is made within one session, on one build and one setup, unless a section says otherwise, and each section dates its runs.
What It Delivers
Throughput, cost and behavior under failure, measured. Each section dates its runs.
One Database
On one 32 vCPU database with the archive on, one engine replica ran 24,242, 23,938 and 24,262 steps/s in three runs (one 16-minute window, two 6-minute), about 2,410 flows/s and 2.1 billion steps a day. A saturated flow waited in the 2,000-flow backlog, so it completed in a median of ~0.89 s, with a p99 of 1.3 s. The engine used 5.5 cores of its 16 vCPU host, ~4,400 steps/s per core. The archive moved closed flows out as fast as they closed and kept the live tables at about a minute’s worth of rows, 1.5 million steps. (Measured 2026-11-06.)
A second instance of the same size, on the same build, ran 18,852 steps/s at 250 connections and 19,221 at 500. The second spent more database CPU per step, 1.26 ms against 1.03, at about the same share of its cores busy (74% against 77%), and a flush of the log, carrying ~62 commits of ~66 KB in both, took 1.03 ms against 0.82. Steps/s times flush time agrees within 1% across the two. Whether its disk or its host was the slower part, these runs do not tell: the extra CPU may be backends contending behind the slower flush. More connections did not close the gap: at 500, each flush carried a third more commits and took a third longer. (Measured 2026-11-06.) (Method Notes describe how to check an instance.)
Database Size: What Limits Each
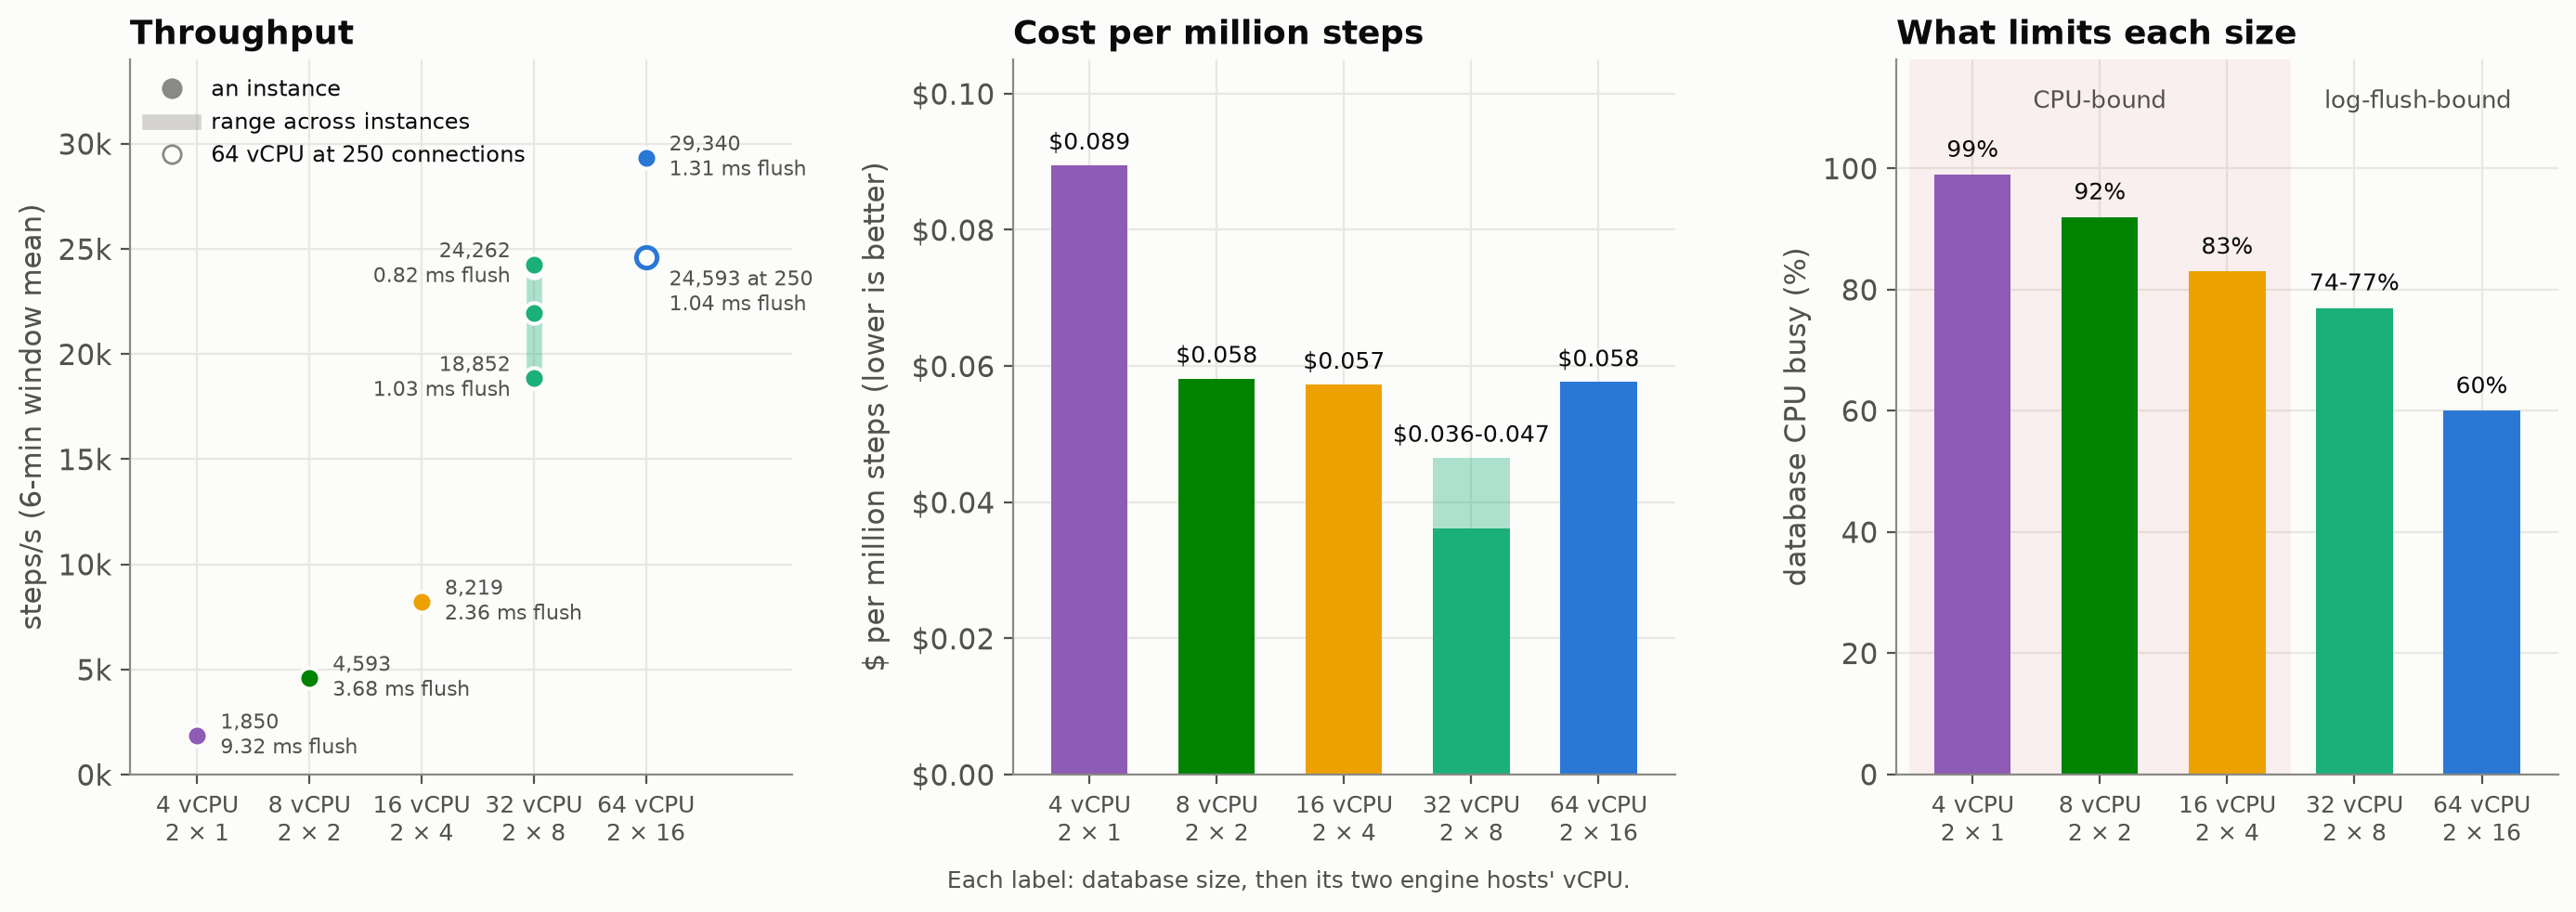
One shard at each database size, saturated, each served by two engine hosts totalling half its vCPU:
| Database | Engines | steps/s | Log flush | Database CPU | Database CPU per step | Monthly cost | $ per million steps |
|---|---|---|---|---|---|---|---|
| 4 vCPU, 16 GB | 2 × 1 vCPU | 1,850 | 9.3 ms | 99% | 2.14 ms | ~$435 | $0.089 |
| 8 vCPU, 32 GB | 2 × 2 vCPU | 4,593 | 3.7 ms | 92% | 1.60 ms | ~$700 | $0.058 |
| 16 vCPU, 64 GB | 2 × 4 vCPU | 8,219 | 2.4 ms | 83% | 1.61 ms | ~$1,240 | $0.057 |
| 32 vCPU, 128 GB | 2 × 8 or 1 × 16 vCPU, priced as 2 × 8 | 18,852–24,262 | 0.82–1.03 ms | 74–77% | 1.03–1.26 ms | ~$2,310 | $0.036–0.047 |
64 vCPU, 256 GB, MaxConnections: 500 | 2 × 16 vCPU | 29,340 | 1.31 ms | 60% | 1.32 ms | ~$4,440 | $0.058 |
The 32 vCPU row is four instances, which ran 18,852, 21,938, 24,108 and 24,262 steps/s (One Database); the others one each. The 64 vCPU database ran 24,593 steps/s at the default 250 connections and 29,340 at 500 on the same instance, +19%: each flush of its log carried half again as many commits for a quarter more time. At 32 vCPU, 500 connections bought 2%. Log flush is the time one flush of the write-ahead log took under this load. Monthly cost is the on-demand list price in one US region: the database (without high availability), its 1 TB SSD, and both engine hosts. The cost per million steps assumes the deployment runs at its measured rate around the clock (730 hours a month); one that averages half that rate pays twice as much per step.
- Below 32 vCPU the database runs out of CPU. The 4, 8 and 16 vCPU databases ran at 83–99% CPU, and each step cost them 1.6–2.1 milliseconds of database CPU. More connections still help these sizes (see How the Connection Budget Was Chosen), so this is a cost of the small instance, not a sign of too many connections.
- From 32 vCPU up, the log’s flush is the limit. A quarter to two fifths of the cores sit idle while every commit waits its turn to reach the disk (below), and more cores do not shorten that.
- So 32 vCPU is the most economical size. Each of its vCPUs delivers 590–760 steps/s, against 460–575 for the
other sizes. From 16 to 32 vCPU, throughput grows 2.3–3 times for 1.9 times the price. From 32 to 64 vCPU it grows
1.2–1.6 times for 1.9 times the price, and only with
MaxConnections: 500. Past 32 vCPU, add shards. - The pairing holds at every size. Each engine host ran at a quarter to a third of its CPU, so either replica can carry its shard alone if the other fails.
(Measured 2026-11-06 to 2026-11-08. Same-size instances differ; see Method Notes.)
The Write-Ahead Log, and Why a Shard Is Its Own Server
On a saturated 32 vCPU shard, ~140 backends wait on the write-ahead log’s write lock at once. A deeper look at a 16 vCPU instance showed that the ceiling is a stack of locks, so buying around one of them does not raise it far:
| connections | steps/s | LWLock/WALWrite waiters | LWLock/BufferContent | on CPU | IO/WALSync |
|---|---|---|---|---|---|
| 96 | 5,355 | 33 | 0.1 | 1.5 | 0.8 |
| 192 | 7,016 | 70 | 2.6 | 7.2 | ~0 |
| 384 | ~6,400 | 99 | 76 | 24 | ~0 |
Counts are database backends sampled in each state. They show where backends wait, not how busy the CPU is.
- The write lock serializes every commit into the log. Writes waited on it, not on the disk: sync waits were ~0.
- Removing the top of the stack exposes the next one about 5% higher. Turning off
synchronous_commiteliminated write-lock waits and bought +4%, because buffer-page contention more than doubled. Checkpoints covers the settings that cut the log’s bytes.
So a shard must be its own server. A PostgreSQL server has one write-ahead log, shared by every database on it. Same total connections, measured directly:
| topology | steps/s | vs one database on one server |
|---|---|---|
| 2 databases, one server | 6,916 | ×1.03 |
| 2 databases, two servers | 13,995 | ×2.08 |
(Measured on 16 vCPU instances; these are properties of PostgreSQL, not of the engine.)
Every flush costs a fixed time plus its bytes. Across 15 saturated runs on one 32 vCPU database, at payloads from none to 64 KB, a flush of the log took about 0.8 ms plus its bytes at ~320 MB/s. The fixed part belongs to the instance: another of the same size took 1.03 ms for the same no-payload flush. With no payload a flush carried ~65 commits of ~70 KB and took ~0.85 ms, about 1,200 a second; at 64 KB it carried ~2.2 MB and took ~7.5 ms. That is the disk’s write latency and bandwidth, and it is why a step’s log bytes set its shard’s rate (Payload Size): the database’s mean CPU stayed at 41–66% in every run. (Measured 2026-11-06.)
Checkpoints
PostgreSQL starts a checkpoint each time it has written about max_wal_size / 1.9 of log, and after it the first
change to each page logs the whole page. One 32 vCPU database, 8 KB of JSON per step, saturated, 16-minute windows,
steps/s read from the fourth minute on (changing a setting restarted the database, and the restart costs the first
minutes after it):
max_wal_size | wal_compression | steps/s | checkpoints | log per step | whole pages logged per step | flow p99 |
|---|---|---|---|---|---|---|
| 20 GB | lz4 | 10,378 | every ~50 s | 21.7 KB | 1.83 | 6.0 s |
| 20 GB | off | 10,107 | every ~50 s | 22.7 KB | 1.80 | 6.9 s |
| 1.5 GB (the service’s default) | lz4 | 7,284 | every 5–10 s | 28.2 KB | 3.60 | 11.0 s |
- The checkpoint size is the large lever: +42%. At the default the database checkpoints every few seconds, logs twice the whole pages per step, and its rate swings from one 10-second sample to the next.
wal_compressionis not worth setting:lz4bought about 3% here, and 1% with 1 MB payloads, where it cost 1.5% more database CPU per step (2026-11-08). The pages it compresses already hold PostgreSQL’s compressed copies of the payloads, so it finds little left to remove.- Size it from the WAL rate:
max_wal_size≈ 2 × peak WAL MB/s × 60 s puts checkpoints about a minute apart at peak. With no payload this database logged ~83 MB/s and checkpointed every ~135 s at 20 GB. The settings are in Deployment.
(Measured 2026-11-06.)
Shards: Throughput Adds Up
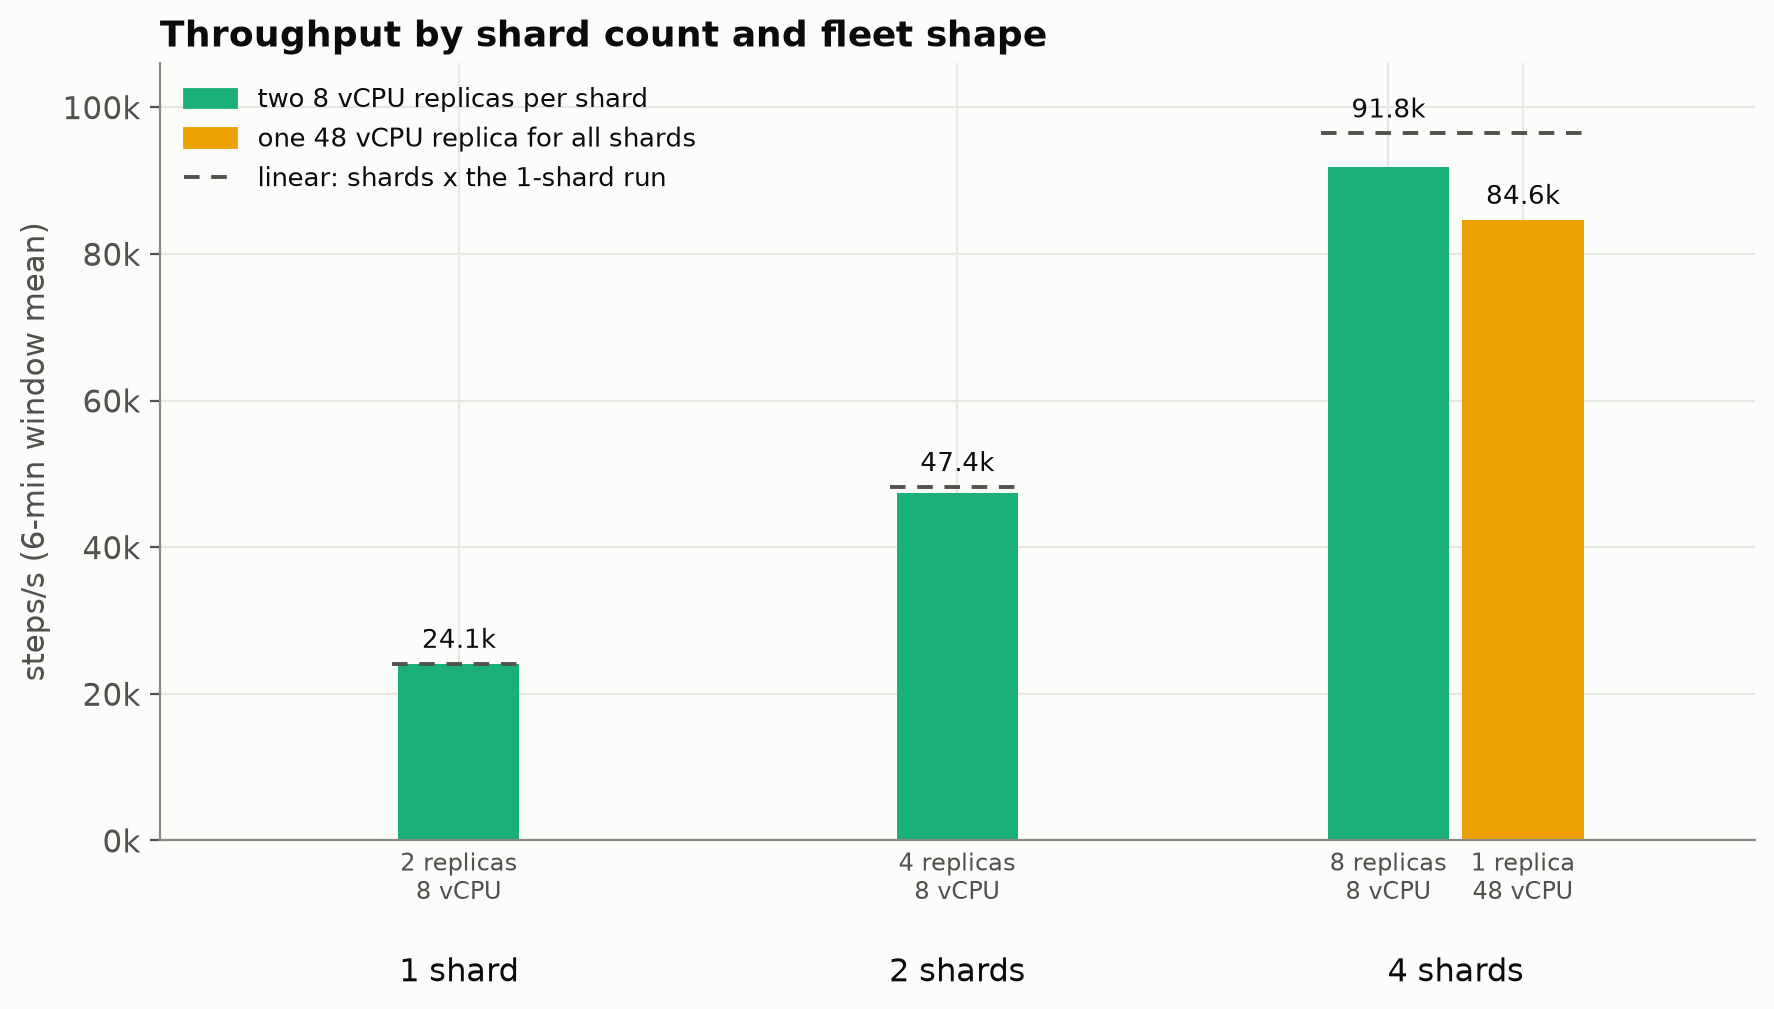
Each shard is its own 32 vCPU database, served by two 8 vCPU engine replicas. All runs used one set of four instances: the four-shard runs first, then the two slowest instances were removed for two shards, and the next for one.
| Shards | Replicas | steps/s | vs 1 shard | Per shard |
|---|---|---|---|---|
| 1 | 2 | 24,108 | ×1.00 | 24,108 |
| 2 | 4 | 47,437 | ×1.97 | 23,719 |
| 4 | 8 | 91,800 | ×3.81 | 22,950 |
- Every shard carries close to what one shard carries alone. The one-shard run is on the fastest of the four instances; the four-shard run includes the two slower ones, which is why its per-shard figure is lower.
- The engines were never the limit. Each 8 vCPU replica used 2.7–3.1 of its cores.
- Every flow completed. No step was left unfinished on any shard in any run.
(Measured 2026-11-06.)
One Engine for Several Shards
The same four shards, served by a single 48 vCPU replica: 84,648 steps/s (×3.51 the one-shard run above), on 22.8 of its 48 cores, with the databases at 60–70% CPU.
- One engine runs four shards at 92% of what replicas get from the same databases. It delivered 84,648 steps/s against the 91,800 that eight 8 vCPU replicas ran on the same four instances, with 25 of its 48 cores idle. Its flows waited longer: a p99 of 5.0 s against 1.1–1.7 s.
- The slowest database sets every shard’s pace. All four shards ran within 0.3% of each other, ~21,200 steps/s each, because the load generator places flows evenly and caps flows in flight across all shards: the slowest shard’s flows stay in flight longest and fill that shared cap. Shards whose databases ran faster sat with free capacity. The same holds for any caller that limits its own concurrency across shards.
(Measured 2026-11-06.)
Replicas: Availability Without a Throughput Cost
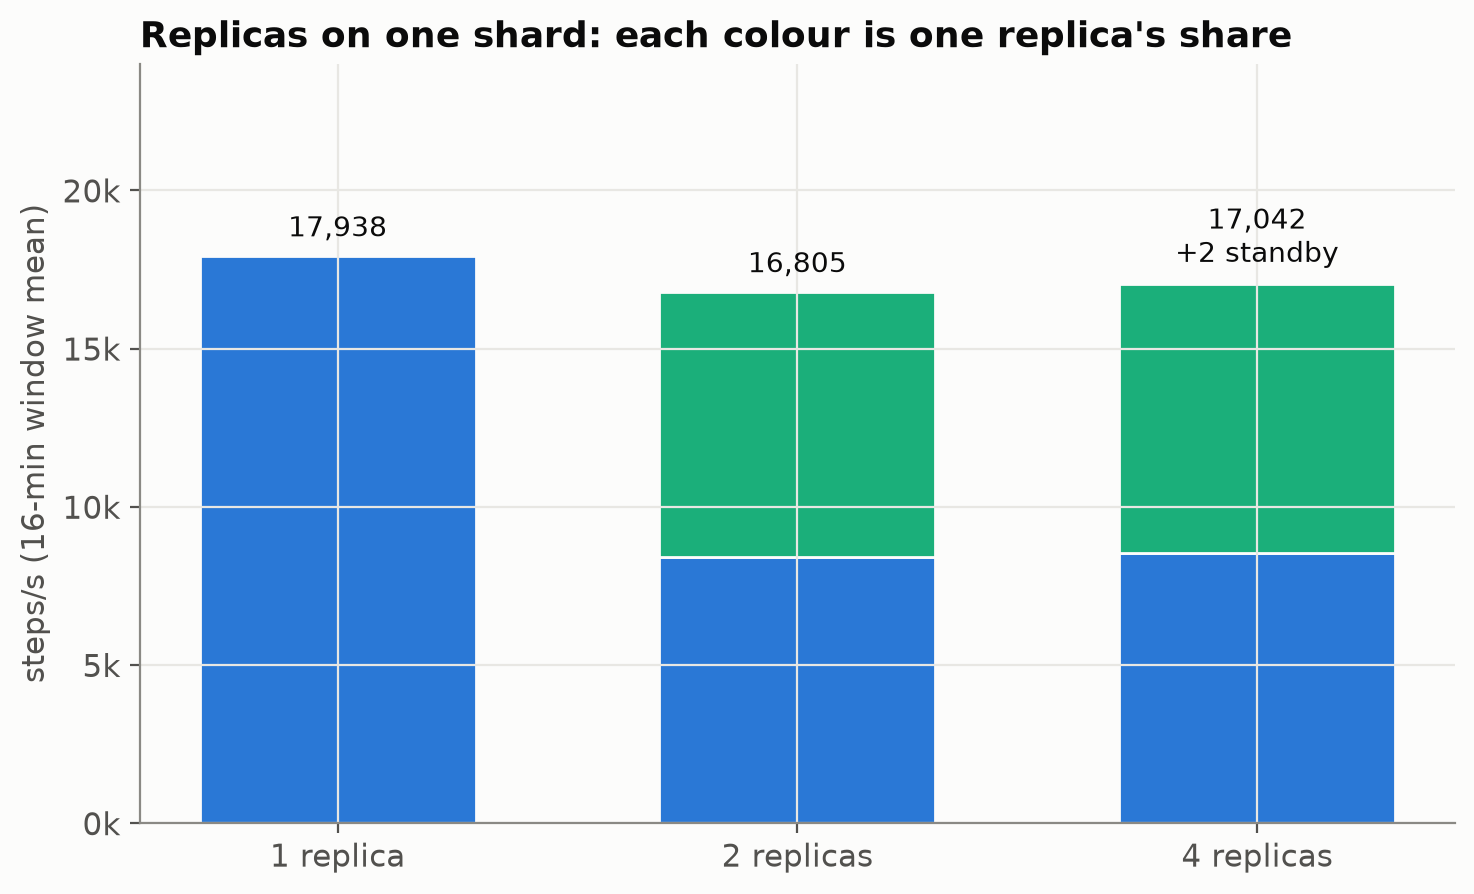
One 32 vCPU shard, served by one, two and four replicas on separate hosts:
| Replicas | steps/s | vs 1 replica | Executing replicas | Engine CPU per executing replica |
|---|---|---|---|---|
| 1 | 17,938 | — | 1 | 5.4 cores |
| 2 | 16,805 | −6.3% | 2 (8,404 + 8,402) | 2.7 cores |
| 4 | 17,042 | −5.0% | 2 (8,526 + 8,516) | 2.6 cores |
- Throughput does not depend on the replica count. Two and four replicas deliver the same throughput, within 6% of one replica. That is inside the spread between runs on one instance.
- Each shard has two dispatchers. As soon as there are two replicas, two of them split each shard’s work evenly (to within 0.1% minute by minute). Other replicas create flows and answer reads, but run none of that shard’s steps. They hold a few connections each, and step in if a dispatcher stops. Deployment describes how the fleet chooses dispatchers and what happens when one fails.
- Across shards, every replica gets work. Different shards pick different dispatchers. At four shards and four replicas, every replica dispatched exactly two shards; at four shards and eight, every replica dispatched exactly one.
(Measured 2026-10-09 on an earlier engine; the ratios between replica counts are what carry over.)
The Recommended Shape
Two 8 vCPU engine replicas for each 32 vCPU database. With S shards, that is 2S replicas, and each
replica dispatches exactly one shard.
Measured at four shards and eight c4a-standard-8 replicas: 91,800 steps/s. At two shards and four replicas, each replica carried 11,800–11,900 steps/s on about 2.9 of its 8 cores. If one replica of a shard fails, the other takes over its share: about 6 cores, which still fits an 8 vCPU host.
Two replicas per shard give each shard a dispatcher to fail over to and keep every replica’s share equal.
Replicas beyond 2S add standby capacity and capacity for your own traffic, not workflow throughput.
The same rule scales down: two engines at half the database’s vCPU (see Database Size).
The Engine Is Cheap
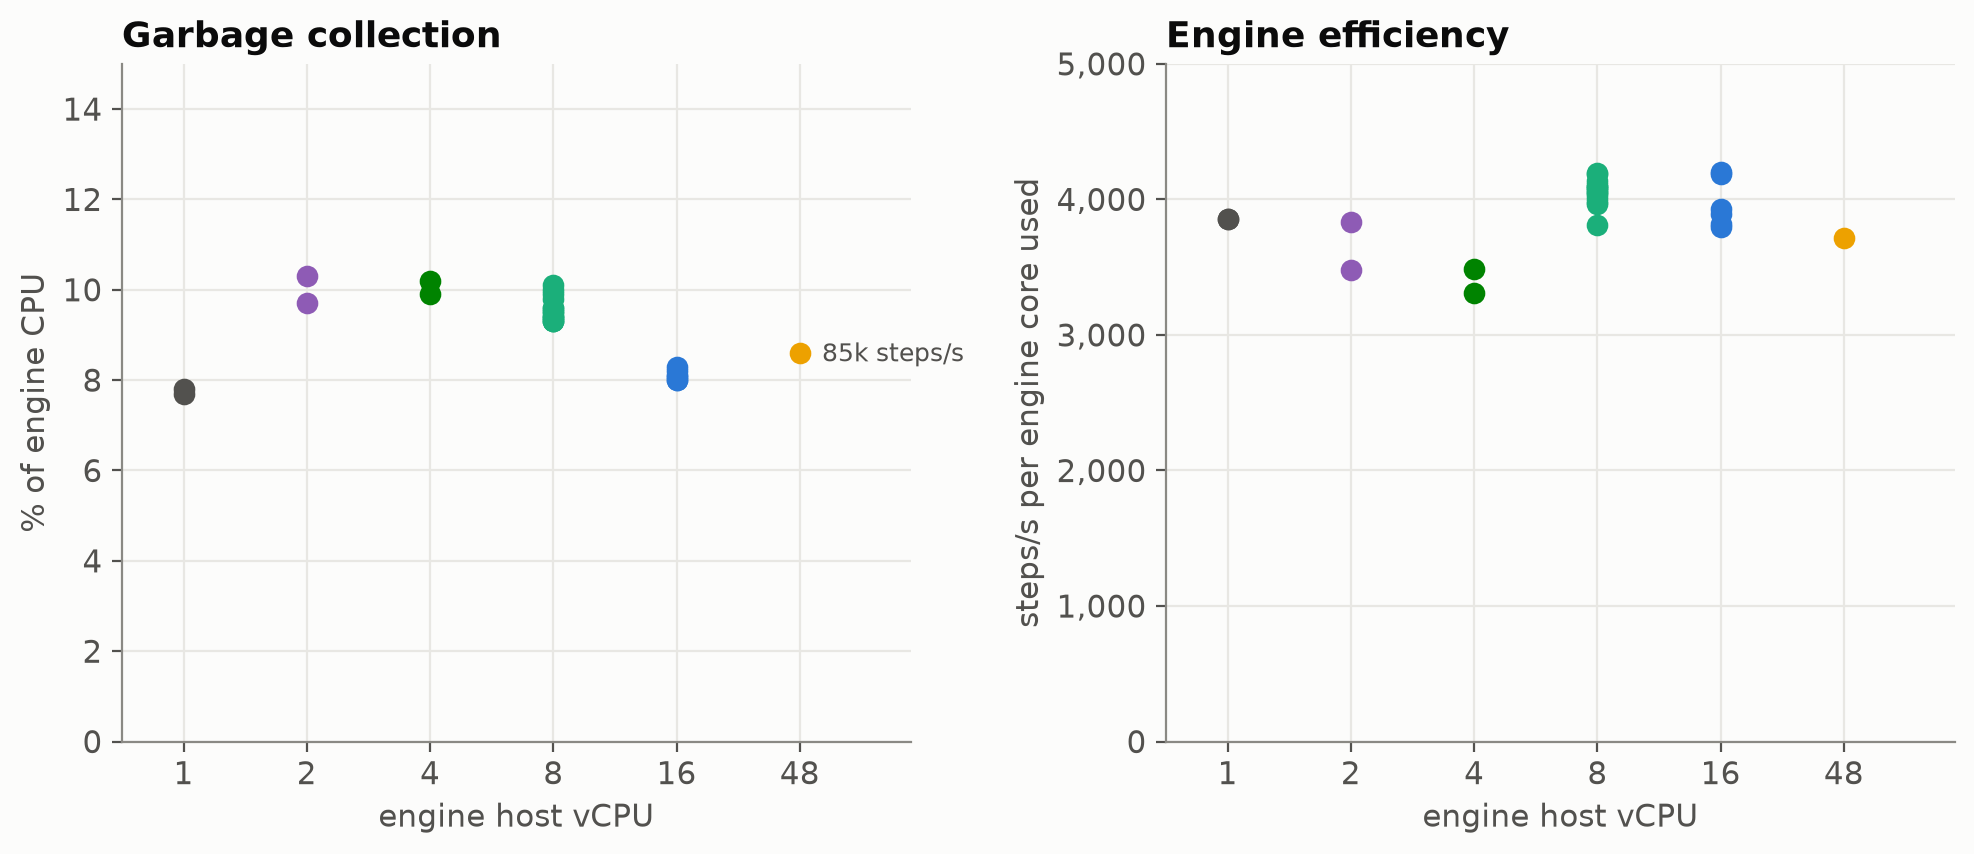
| Engine host | Runs | steps/s per engine core | Garbage collection, share of engine CPU |
|---|---|---|---|
| 1 vCPU | 2 replicas on a 4 vCPU database | 3,850 | 8% |
| 2 vCPU | 2 replicas on an 8 vCPU database | 3,480–3,830 | 10% |
| 4 vCPU | 2 replicas on a 16 vCPU database | 3,310–3,490 | 10% |
| 8 vCPU | 2 replicas per shard, 1 to 4 shards | 3,810–4,190 | 9–10% |
| 16 vCPU | 1 replica on a 32 vCPU database, or 2 on a 64 vCPU one | 3,800–4,200 | 8% |
| 48 vCPU | 1 replica on 4 shards | 3,720 | 9% |
- The database is the limit. An engine host from 1 to 16 vCPU runs at a quarter to a third of its CPU while its database is saturated, and a 48 vCPU host serving four shards at under half.
- Steps per core and garbage collection’s share hardly depend on the host’s size. Every host ran 3,300–4,200 steps/s per core, with garbage collection at 8–10% of the engine’s CPU.
These figures are the engine’s own cost, measured 2026-11-06. Your tasks run on the same hosts and need their own headroom.
Minute by Minute
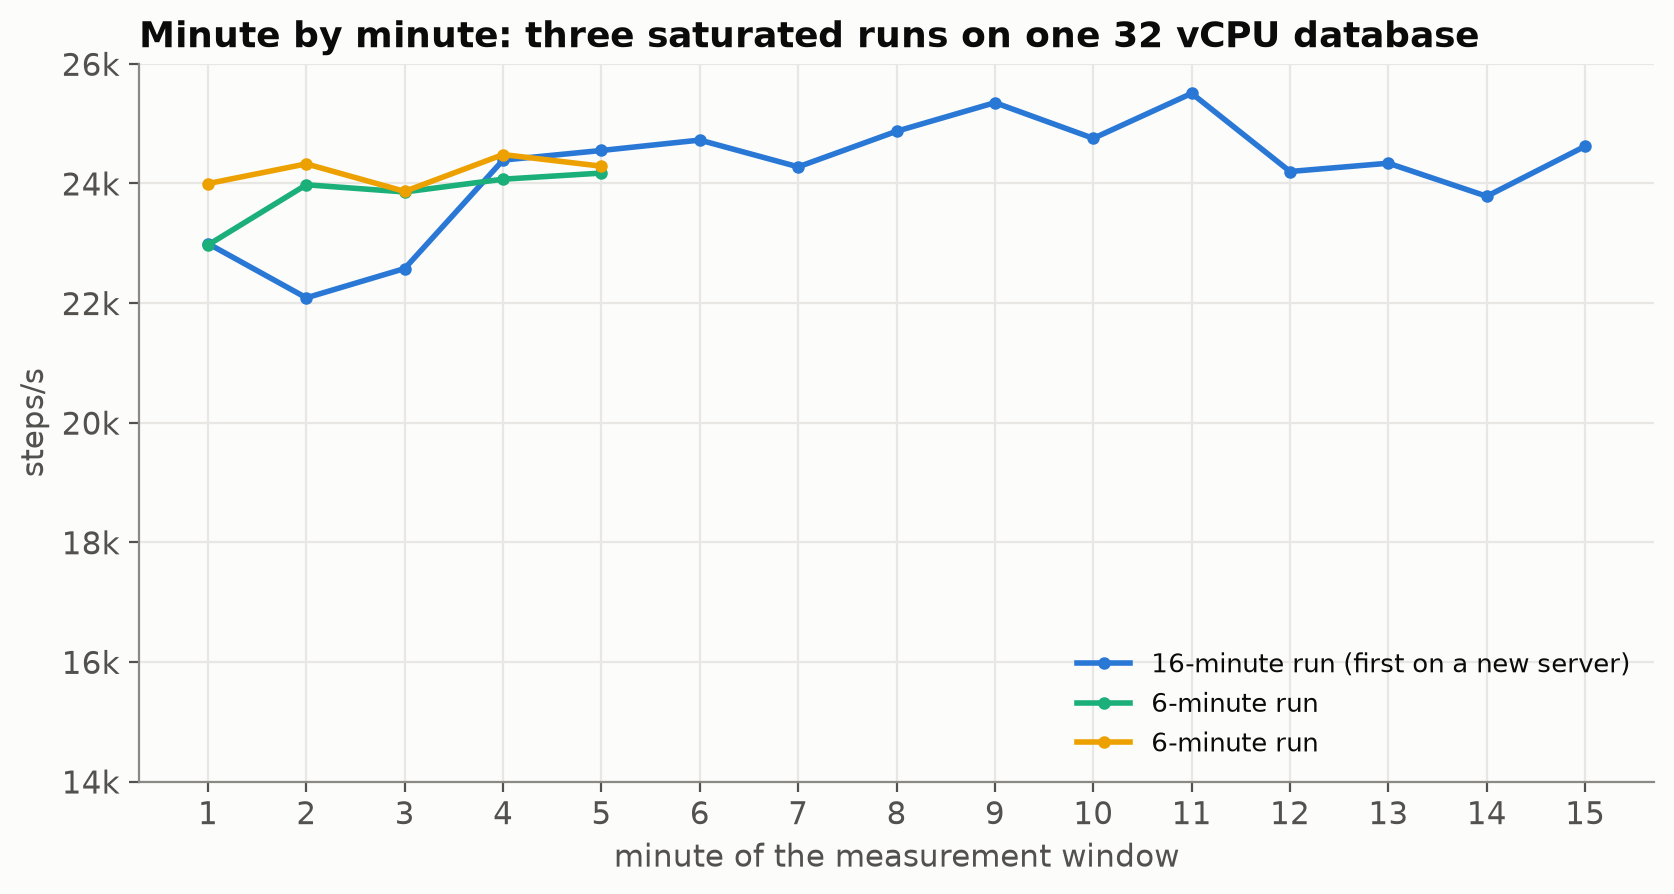
The vertical axis starts at 14,000 steps/s.
A saturated run holds its rate to the end of its window: from its fourth minute to its last, the 16-minute run above held 23,800–25,500 steps/s and did not drift down, and the two 6-minute runs held 23,000–24,500 throughout. The rate a run settles at is the rate to plan on. Over hours and a growing database, Database Volume applies.
The 16-minute run’s first three minutes ran ~8% lower because it was the first on a database server created minutes before: until its first checkpoints complete, a new server creates each 16 MB log file instead of reusing one, and every commit waits behind that. The runs after it on the same server started at full rate.
(Measured 2026-11-06.)
Sustained Load
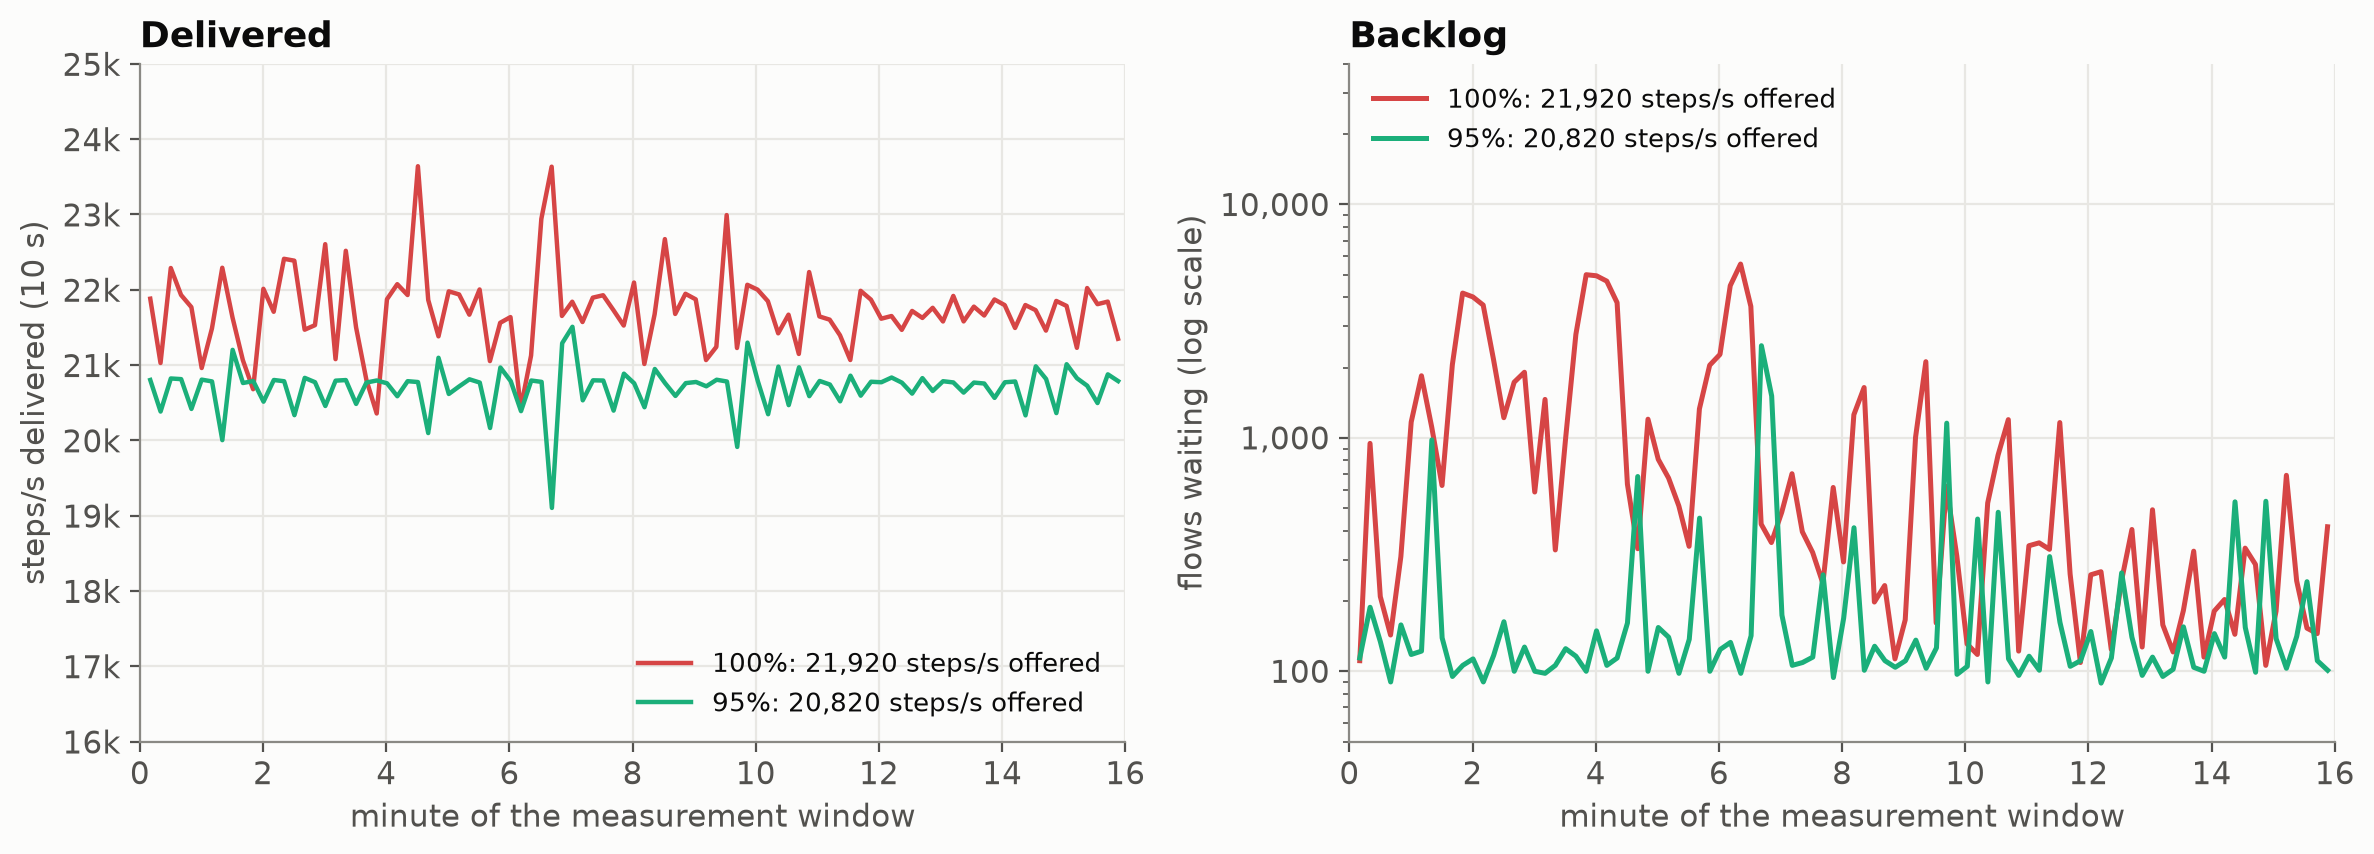
How much a database sustains. One 32 vCPU database with the archive on was first run saturated (21,938 steps/s on this instance), then offered fixed rates at 100% and at 95% of that, 16 minutes each:
| offered steps/s | % of saturated | delivered | flows waiting, first → last minute (peak) | flow p50 | flow p99 |
|---|---|---|---|---|---|
| saturated | — | 21,938 | held at 2,000 | 0.98 s | 1.4 s |
| 21,920 | 100% | 21,730 | 481 → 305 (5,555) | 200 ms | 2.5 s |
| 20,820 | 95% | 20,698 | 134 → 139 (2,482) | 61 ms | 1.1 s |
- At 95% flows barely wait. The backlog stayed near 130 flows apart from a few short spikes, and the median 10-step flow completed in 61 ms against ~1 s when saturated.
- At 100% the database keeps up, but only just. Each dip in its rate left a backlog of a few thousand flows that took a minute or two to clear, and the p99 was more than twice the 95% run’s. The saturated rate is a ceiling, not a target.
(Measured 2026-11-08.)
How to plan for peaks above that rate is in Planning for Peaks.
Long Tasks
A task that waits on something slow, such as a model call or a human, ties up the flow but not the database. These runs check that the engine keeps the offered rate as tasks lengthen, and that a waiting task costs little.
Seconds-long tasks at a fixed rate. 1,000 flows/s of the 10-step linear workflow, about 10,000
steps/s or half of what the database runs saturated, with every task sleeping 0, 1 or 8 seconds. One
32 vCPU database, one 16 vCPU engine host, a 6-minute window after 2 minutes of warmup (2026-10-10):
| Task duration | flows/s | steps/s | Flow p50 | Flow p99 | Hand-off per step | Flows in flight | Engine CPU | Create p99 |
|---|---|---|---|---|---|---|---|---|
| 0 s | 999 | 9,988 | 0.045 s | 0.37 s | ~5 ms | ~750 | 2.7 cores | 29 ms |
| 1 s | 999 | 9,987 | 10.06 s | 10.47 s | ~6 ms | ~10,500 | 3.0 cores | 68 ms |
| 8 s | 997 | 9,970 | 80.09 s | 80.42 s | ~9 ms | ~80,250 | 3.2 cores | 49 ms |
Hand-off per step is the flow p50, less ten task durations, divided by the ten steps.
- Task duration drops out of throughput. Every run delivered the offered rate, and a flow took ten times its task duration plus a few milliseconds per step.
- The database does the same work at every duration. It committed ~31,000 transactions/s in all three runs. A task in progress holds no database connection.
- Creating a flow stays fast.
Createp99 stayed between 29 and 68 ms at every duration, while the engine held up to 80,000 flows in flight. On the current engine it is ~6 ms at this rate (below). - Memory follows flows in flight. Holding ~80,000 flows, the engine’s heap peaked at ~1.2 GB, about
15 KB per flow.
SetWorkerscaps the number of tasks in progress on a replica if memory must be bounded.
Minute-long tasks. One 60-second task per flow, the shape of a workflow that waits on a model call, with a fixed number of flows in flight:
| Flows in flight | flows/s | In flight ÷ 60 s | Flow p50 | Flow p99 | Worker goroutines | Engine CPU |
|---|---|---|---|---|---|---|
| 500 | 8.3 | 8.3 | 60.008 s | 60.044 s | 502 | 0.04 cores |
| 2,000 | 33.3 | 33.3 | 60.011 s | 60.110 s | 2,002 | 0.14 cores |
| 10,000 | 166.7 | 166.7 | 60.013 s | 60.276 s | 10,004 | 0.74 cores |
- Throughput is the work in flight divided by the task duration, exactly, at every level, and a flow takes as long as its task and no longer.
- The engine grows its workers to fit the work. It ran one worker per task in progress and needed under one core to hold 10,000 of them.
Mixed durations on one engine. The same rate and setup, with each task’s duration drawn at random from weighted classes, so fast and slow tasks share one engine (2026-10-18):
| Task durations | steps/s | Flow p50 | Flow p99 | Create p99 | Workers | Database connections in use |
|---|---|---|---|---|---|---|
| none | 9,994 | 39 ms | 0.17 s | 6.1 ms | 500 | 43 mean |
| 80% 5 ms, 15% 200 ms, 5% 8 s | 9,998 | 671 ms | 24.1 s | 6.3 ms | ~4,700 | 43 mean |
| 85% 2 ms, 12% 100 ms, 3% 5 s | 9,997 | 252 ms | 10.2 s | 5.5 ms | ~2,050 | 43 mean |
- Each mix runs at the latency its durations predict. Ten draws per flow from the mix, plus the few milliseconds per step of the no-delay run, predicted a p50 of ~680 ms and ~260 ms and a p99 of ~24 s and ~10 s. Slow tasks do not hold up fast ones.
- The engine grows workers for the slow tasks, not connections. Workers rose to ~4,700 for the mix with 8-second tasks, while the database connections in use stayed the same as with no delay.
No flow errors in any of these runs.
Failover
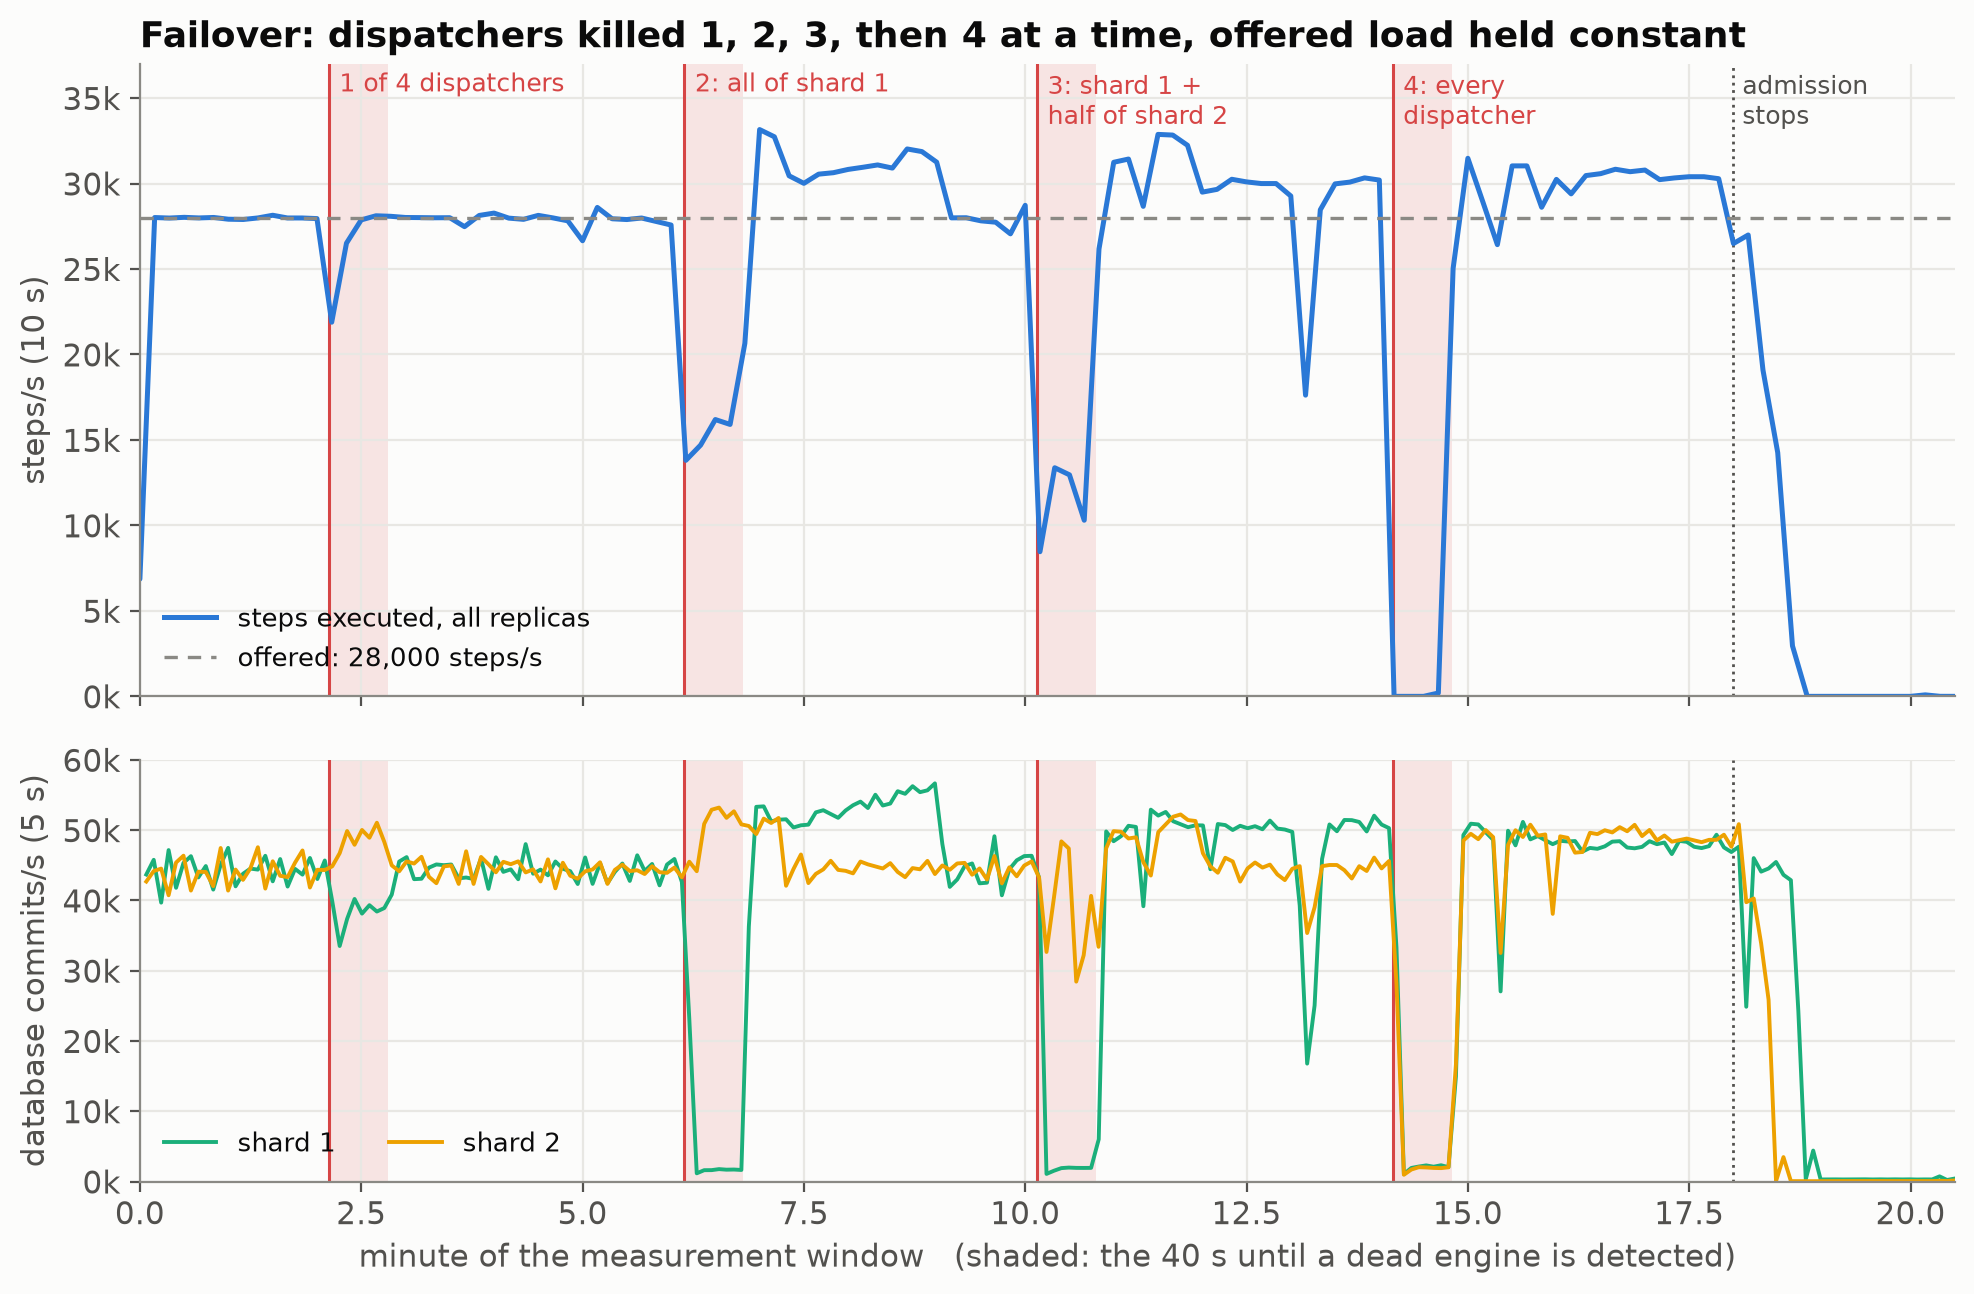
Two shards, each a 32 vCPU database, served by eight 8 vCPU engine replicas: four dispatchers (two per
shard) and four standbys. The offered load is fixed at 2,800 flows/s, 28,000 steps/s, about 80% of what
the two shards run saturated. At window minutes 2, 6, 10 and 14, 1, 2, 3 and then 4 of the current
dispatchers are killed at once (SIGKILL), and each killed engine is restarted ~8 s later, as an
orchestrator would. Admission stops at minute 18.
| Kill | Dispatch lost | Throughput during the outage | Back to full dispatch |
|---|---|---|---|
| 1 dispatcher | half of shard 1 | 22,000–26,500 steps/s | ~30 s |
| 2 dispatchers | all of shard 1 | 14,000–16,000 steps/s (shard 2 unaffected) | ~40 s |
| 3 dispatchers | all of shard 1, half of shard 2 | 8,500–13,000 steps/s | ~40 s |
| 4 dispatchers | every shard | 0 | ~40 s |
- No flow is lost. All 3,334,099 flows completed. None failed, none was left running, and no replica records were left behind.
- A dead engine is detected in about 40 seconds, and a standby takes its place. A shard that keeps one dispatcher keeps running at that dispatcher’s share; a shard that loses both pauses until the standbys take over.
- A restarted engine rejoins as a standby. Dispatch roles go to the longest-running replicas, so a loss on one shard can move roles on the other. Those moves cost no throughput.
- Flows keep arriving during an outage, and headroom sets the catch-up. After each takeover the fleet ran 30,000–33,000 steps/s, above the offered rate, until the backlog cleared: about 2 minutes after losing one shard’s dispatch. After losing all of them, ~107,000 flows were still waiting when admission stopped 4 minutes later, and they completed within 3 minutes. A fleet with more headroom catches up faster.
Payload Size
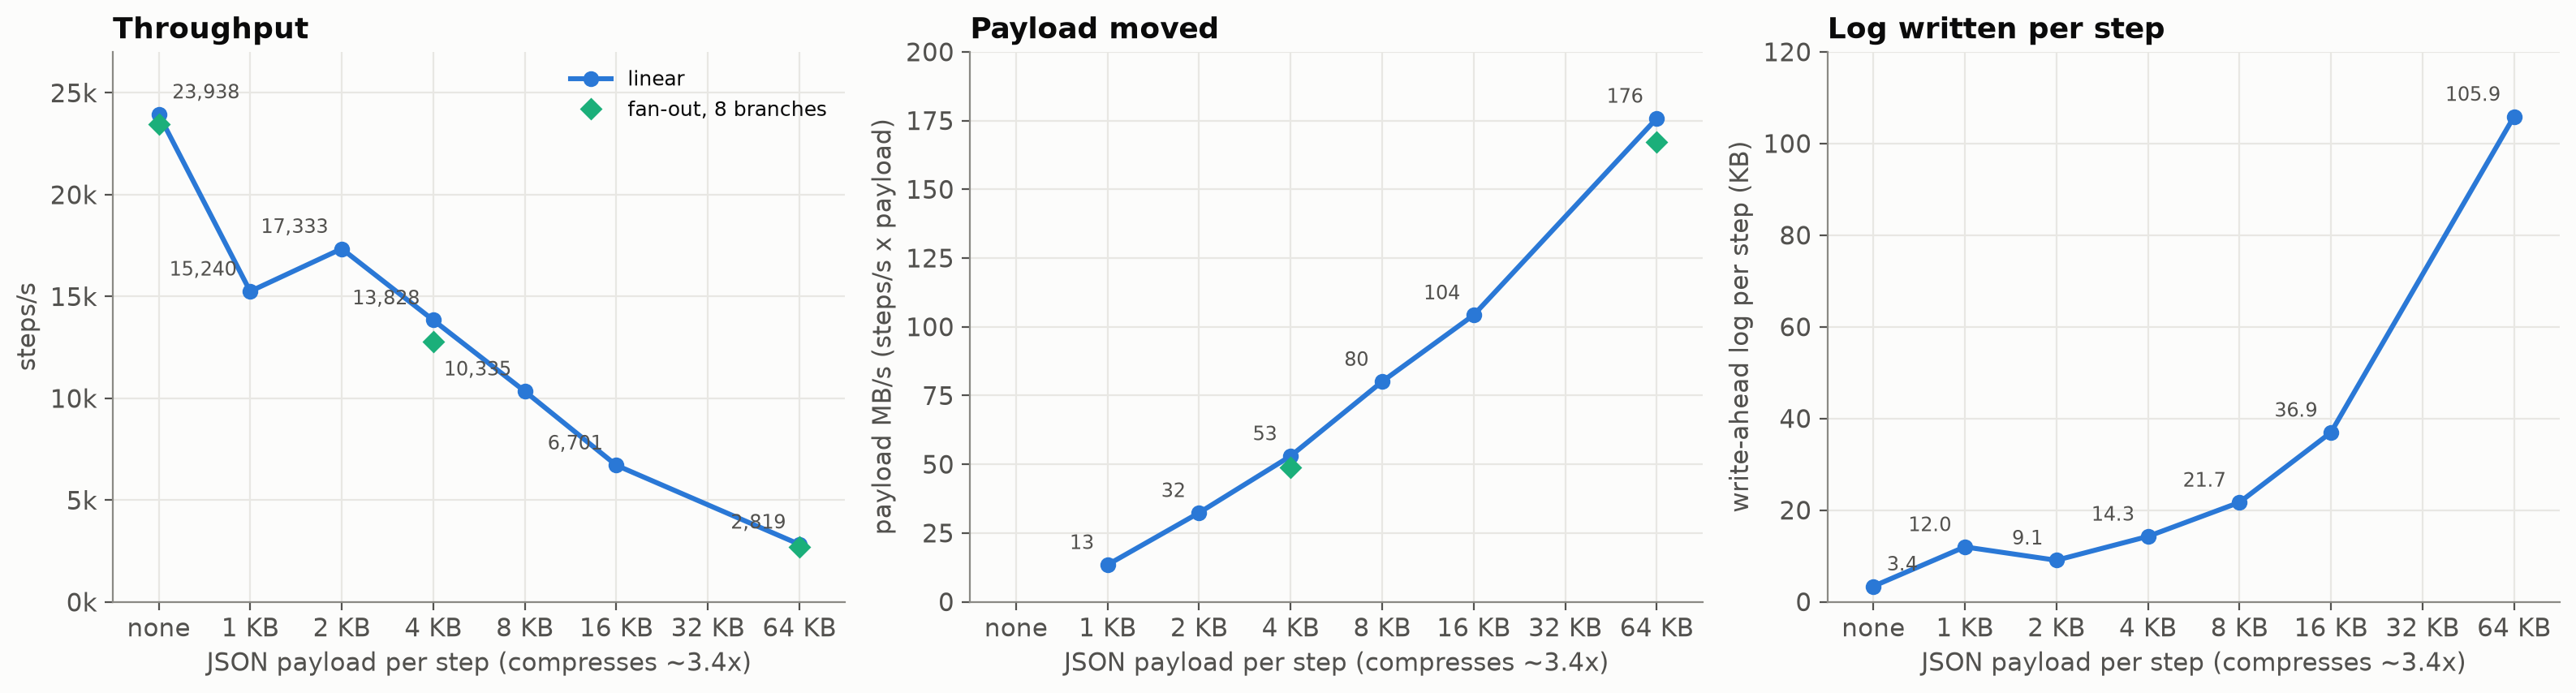
The 10-step linear workflow on one 32 vCPU database with the archive on, each task writing a fresh JSON document
of the given size: an array of records whose keys and words repeat, like real documents. It compresses about
3.4 times, so the database stores and logs it compressed, as it would yours. Saturated, 6-minute windows (8 KB:
16 minutes), checkpoints sized as recommended:
| Payload | steps/s | Payload MB/s | Log MB/s | Log per step | Whole pages logged per step | Flow p50 | Flow p99 |
|---|---|---|---|---|---|---|---|
| none | ~24,100 | — | 83 | 3.4 KB | 0.11 | 0.89 s | 1.3 s |
| 1 KB | 15,240 | 13 | 187 | 12.0 KB | 1.16 | 1.4 s | 2.8 s |
| 2 KB | 17,333 | 33 | 161 | 9.1 KB | 0.61 | 1.2 s | 2.7 s |
| 4 KB | 13,828 | 52 | 202 | 14.3 KB | 1.22 | 1.4 s | 3.9 s |
| 8 KB | 10,335 | 78 | 229 | 21.7 KB | 1.83 | 1.8 s | 6.0 s |
| 16 KB | 6,701 | 105 | 254 | 37.0 KB | 3.32 | 2.3 s | 11.2 s |
| 64 KB | 2,819 | 176 | 306 | 105.9 KB | 8.59 | 6.4 s | 23.5 s |
- From 4 KB up, a step logs about 10 KB plus 1.5 times its payload, and throughput follows the log: each flush costs ~0.8 ms plus its bytes (above). Plan large payloads in log MB/s, not steps/s.
- Small payloads cost the most per byte, and 1 KB ran slower than 2 KB. The likely reason: PostgreSQL compresses a row’s large values only once the row passes about 2 KB, so a 1 KB payload is stored and logged whole, while a 2 KB one is compressed to less.
- Fan-out costs the same. The 8-branch fan-out, also 10 steps per flow, ran 23,459 steps/s with no payload,
12,764 at 4 KB and 2,679 at 64 KB: 3–8% below
linearat each. - Saturated latency grows with the payload. At 64 KB a flow’s p99 was 23.5 s. These are saturated runs; a database offered 95% of its rate keeps flows far shorter (Sustained Load).
(Measured 2026-11-06.)
Engine Memory with Large Payloads
The engine keeps recently written and read large state fields in memory, so the steps that read them next do not go back to the database. That cache, not the work in progress, is most of the engine’s memory with large payloads. State inside running tasks never exceeded 25 MB.
The cache is sized in bytes: by default a tenth of the memory the engine’s process may use, GOMEMLIMIT when it
is set (SetStateCacheSize chooses another size). One 32 vCPU database and a 64 GB engine host, a
scatter workflow (a task writes an array of 8 incompressible elements; each of 8 branches reads its own), with the
cache at several sizes:
| Workload | Cache | steps/s | Engine heap, mean | Engine heap, peak |
|---|---|---|---|---|
| 8 × 1 MB | ~15.5 GB (a quarter of memory) | 176 | 32.8 GB | 50.1 GB |
8 × 1 MB, GOMEMLIMIT=48GiB | 12 GB (a quarter of the limit) | 178 | 27.0 GB | 44.1 GB |
| 8 × 256 KB | ~15.5 GB (a quarter of memory) | 670 | 26.6 GB | 36.9 GB |
| 8 × 256 KB | 1 GB | 649 | 3.7 GB | 7.0 GB |
- A cache smaller than the work in flight costs little. At 256 KB, a 1 GB cache instead of 15.5 GB cost 3% of throughput and cut the heap about seven-fold. A miss reads the field from the database again, which is cheap next to the payload writes that set the pace. The default is a tenth of memory for that reason.
- Set
GOMEMLIMITon engine hosts that carry large payloads. Go’s garbage collector lets the heap reach about twice what it holds; the limit bounds the whole process, and the cache is sized from it.
(Measured 2026-10-14.)
State Size
How large a payload one step can carry, on one 32 vCPU database and one 16 vCPU engine host. Each flow is 5 steps, and every step writes a fresh, incompressible value of the given size; one or four flows run at a time:
| Payload per step | MB/s, 1 / 4 flows | Flow time p50, 1 / 4 flows | Engine heap mean / peak, 4 flows |
|---|---|---|---|
| 8 MB | 46 / 139 | 0.8 / 0.9 s | 9.6 / 13.3 GB |
| 32 MB | 48 / 141 | 3.0 / 4.3 s | 10.4 / 14.6 GB |
| 64 MB | 49 / 137 | 6.2 / 8.7 s | 11.3 / 15.8 GB |
| 128 MB | 47 / 132 | 12.8 / 17.8 s | 12.9 / 19.4 GB |
| 250 MB | 44 / 134 | 26.1 / 34.9 s | 16.2 / 24.6 GB |
- The engine adds no limit of its own. Every run completed without an error or a re-run step. A step’s value can be as large as the database column allows, which on PostgreSQL is just under 256 MB.
- Large payloads move at a byte rate: ~45–49 MB/s for one flow and ~135 MB/s for four, whatever the size. A 250 MB step takes about 5 seconds alone.
- Engine memory is the state cache plus about ten times each payload in flight. The cache stayed within its budget (a tenth of the host’s memory, ~6 GB here) at every size; with four 250 MB steps in flight the heap held ~10 GB beyond it. Peaks ran 1.5–2 times the mean. Size engine hosts for the cache, plus ten times the largest payloads you expect in flight at once, plus that headroom.
(Measured 2026-10-18.)
Sizing and Reproducing
What sets the engine’s defaults, what moves the numbers, and how to measure your own. The recipe for sizing a deployment from these results is in Deployment.
Network Distance
A step makes about five database round trips on PostgreSQL, and each holds a connection while it travels, so the time to the database is paid five times per step. Measured with a deliberately small pool of 8 connections, the time a step holds a connection is 5.19 × round trip + 7.88 ms.
The engine compensates by opening more connections as distance grows: 250 per shard up to 0.25 ms,
rising linearly to 500 at 1 ms and beyond (clamped to half the server’s max_connections). Measured at
0.25 and 1 ms, steps/s, with the connections per shard in parentheses:
| Database | 0.25 ms | 1 ms, same connections | 1 ms, twice the connections |
|---|---|---|---|
| 16 vCPU | 8,484 (200) | 8,006 (200), −6% | 8,373 (400), −1% |
| 32 vCPU | 20,863 (250) | 19,363 (250), −7% | — |
| 64 vCPU | 22,301 (250) | 19,567 (250), −12% | 24,254 (500), +9% |
- Out to 1 ms, twice the connections recover what distance costs, which is what the ramp to 500 is for. (A 64 vCPU database gains from 500 connections even nearby.)
- Past 1 ms, co-locate. Each further millisecond costs about five per step, and the budget does not keep growing. A cross-zone hop on Google Cloud is ~1.1 ms; keep the engine in its database’s zone.
(Measured 2026-10-07/08 with network delay added on the engine host, with the same connection budget.)
How the Connection Budget Was Chosen
The budget of 250 connections per shard is measured, not guessed.
- More connections keep helping, and do not collapse. On a 16 vCPU database at 0.25 ms, pinned pools of 59, 88, 192 and 384 connections ran 5,478, 6,647, 7,802 and 8,185 steps/s. The gain comes from group commit: more committers per WAL flush (22 → 70). The run at 384 was the steadiest of the set.
- A budget of 125-250 connections beat a smaller pool sized per vCPU at every size: +42% at 4 vCPU, +7% at 8, +15% at 16, +10% at 32 and +10% at 64 vCPU. A 4 vCPU database ran stable at 250 connections, so one constant serves every size.
- A constant, clamped to the server. Half of
max_connectionsis the ceiling, so a small or tightly configured server is never handed all its connections. Two dispatchers per shard split the budget. MaxConnectionsis the lever. A 64 vCPU database wants ~500 even nearby (+14–22%); a database shared with other work wants less. See Deployment.
(Measured 2026-10-07/08, saturated, 16-minute windows, one run per setting.)
Database Volume
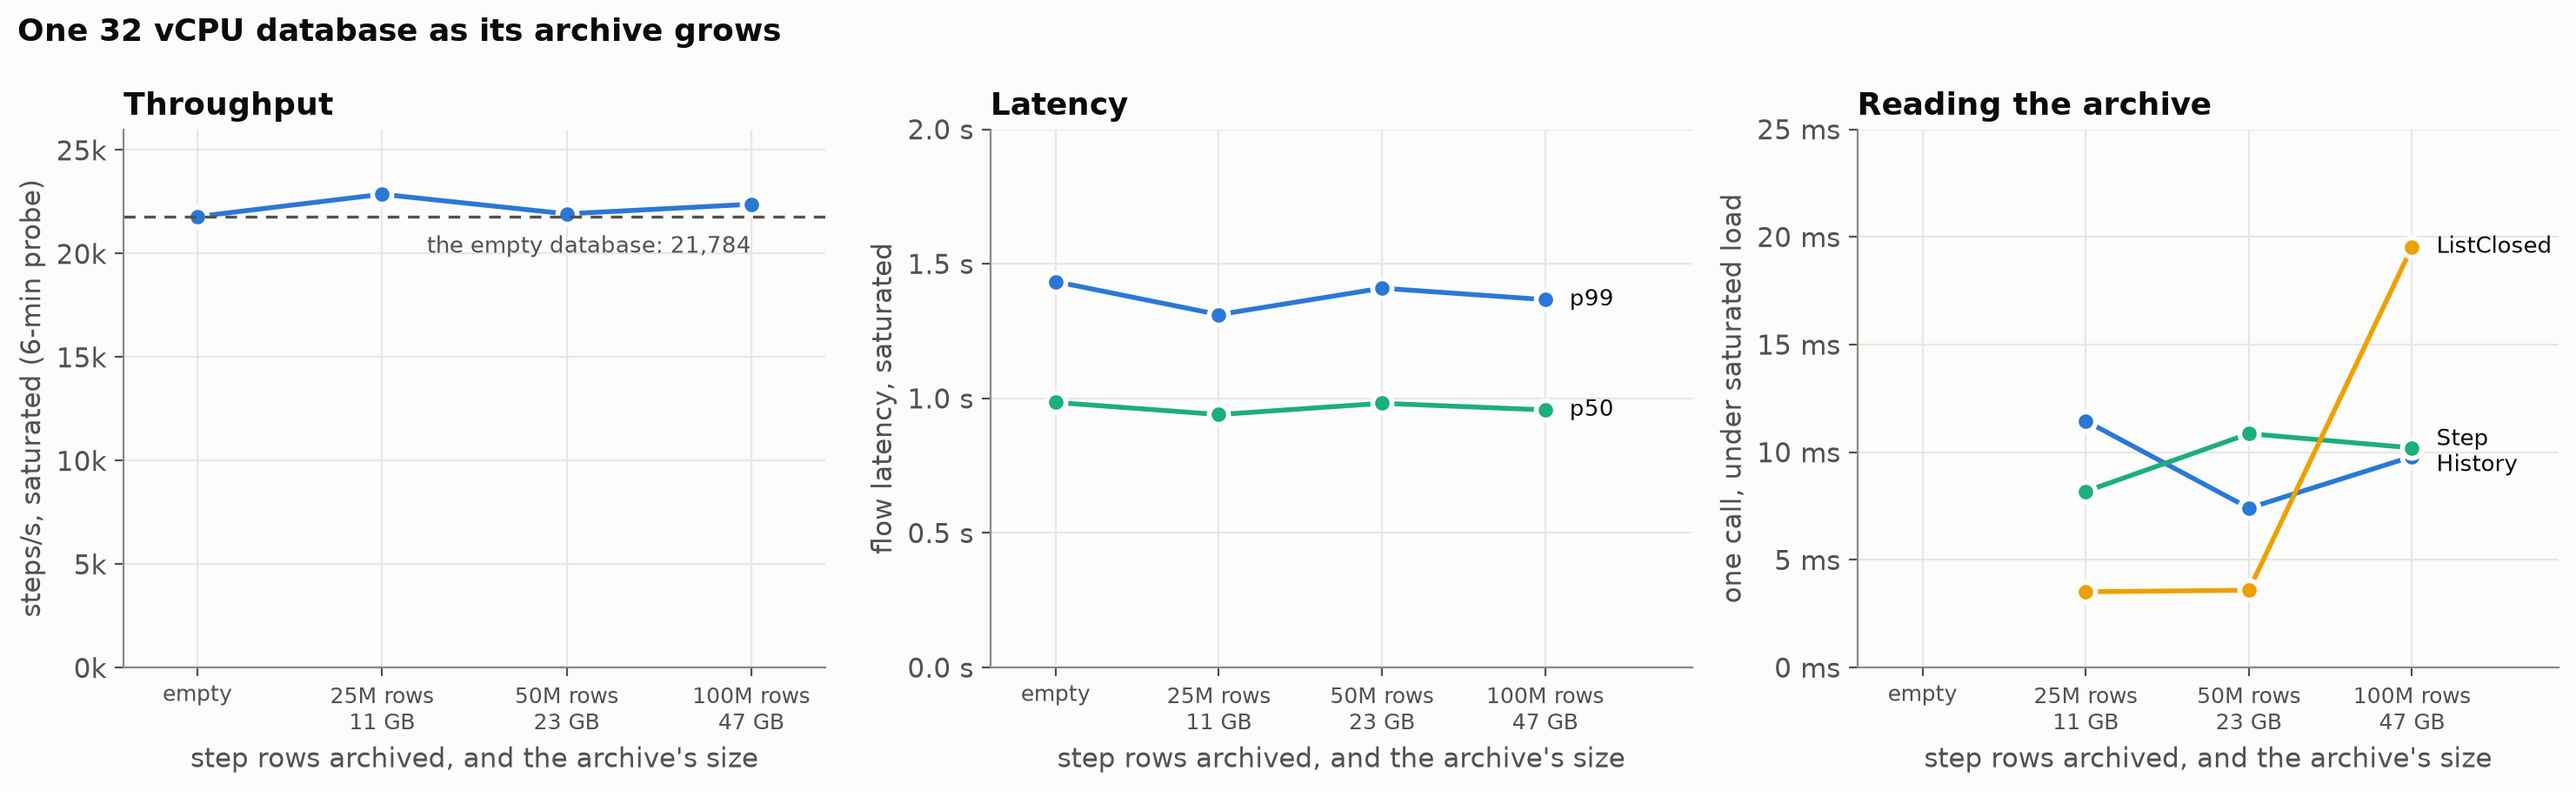
A growing archive. One 32 vCPU database with a 1 TB disk ran the 10-step linear workload with no payload,
saturated, until its archive held 100 million step rows and 10 million flows, 47 GB, all in one archive day. At
0, 25, 50 and 100 million step rows the load paused for a 6-minute saturated run and a timing of three archive
reads: History and Step of the first flow archived, and ListClosed’s newest 100 flows:
| Step rows | Archive | Saturated steps/s | vs empty | Flow p50 | Flow p99 | History | Step | ListClosed |
|---|---|---|---|---|---|---|---|---|
| empty | — | 21,784 | — | 0.99 s | 1.4 s | — | — | — |
| 25M | 11 GB | 22,861 | +4.9% | 0.94 s | 1.3 s | 11 ms | 8 ms | 3.5 ms |
| 50M | 23 GB | 21,915 | +0.6% | 0.98 s | 1.4 s | 7 ms | 11 ms | 3.6 ms |
| 100M | 47 GB | 22,379 | +2.7% | 0.96 s | 1.4 s | 10 ms | 10 ms | 19.5 ms |
Each read is one call, timed while the database ran saturated.
- Throughput and latency did not move as the archive grew. Every saturated run was at or above the empty database’s rate, with the same median and p99.
- Archived reads stay fast.
HistoryandStepof the oldest flow took 7–11 ms at every size.ListClosedtook 3.5 ms up to 50 million rows and 19.5 ms at 100 million. - One
Purgeof 4,096 archived flows took 408 ms at 100 million rows.
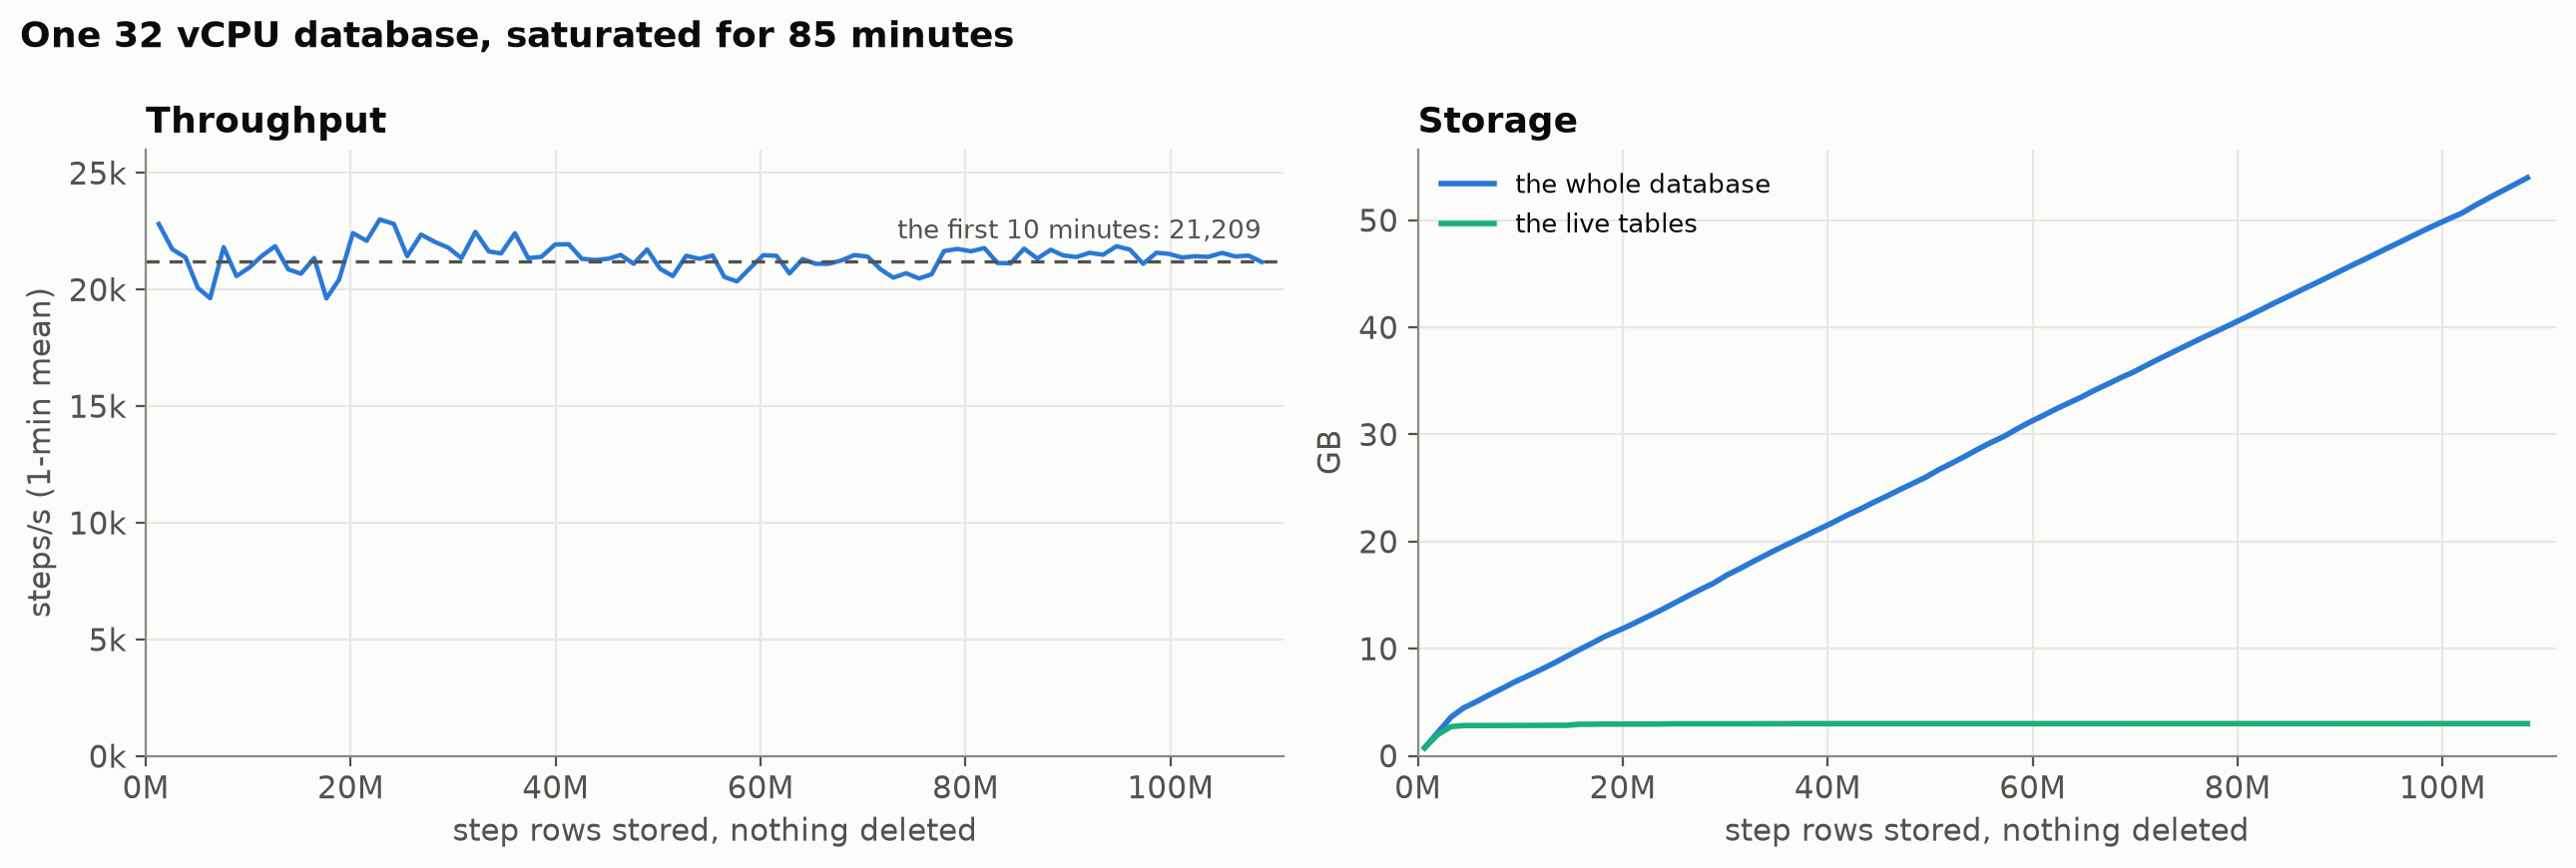
Minute by minute, the same run held its rate from the first minute to the last, 85 minutes and ~110 million step rows later. Closed flows left the live tables about a minute after closing, so the live tables stayed at ~3 GB while the database grew by about 0.5 GB per million steps, to 58 GB. The whole database still fit in the instance’s 128 GB of memory.
Day rollovers and retention. On the same database, with archive days shortened to 10 minutes by a test setting and a retention of one day, a 30-minute saturated run crossed three day boundaries and dropped a day at each: 21,246 steps/s, no 10-second sample below 87% of the median, and no flow error. Starting a day and dropping one cost nothing visible.
Reading the archive while it runs. On the same database, saturated, with concurrent readers each calling
History on archived flows in a loop:
| Readers | steps/s | vs no readers | Archived reads/s | Read p50 | Read p99 |
|---|---|---|---|---|---|
| none | 21,938 | — | — | — | — |
| 32 | 21,421 | −2% | 856 | 28.5 ms | 122 ms |
| 128 | 18,539 | −15% | 3,186 | 29 ms | 185 ms |
- Reads take a share of the database, not a lock. The locks held outside PostgreSQL’s per-backend fast path stayed at ~170–180 with or without readers, and backends waiting on the lock manager stayed near zero. The cost is the reads’ own connections and database time.
- A read held its latency as readers quadrupled: a median of ~29 ms at 32 and at 128 readers.
(Measured 2026-11-08.)
Method Notes
- Use a fresh database for every configuration, so one run’s rows and dead tuples are not part of the next run’s measurement.
- Size disk IOPS to the write rate. Cloud SQL provisions ~30 IOPS per GB, so a 100 GB disk gives ~3,000 IOPS (~23 MB/s of random writes) and a write-heavy workload measures the disk. Every run here used 1 TB.
- Know what your test payload compresses to. PostgreSQL compresses large values. A repetitive payload, such as one character repeated, compresses far more than real data and measured ~3 times higher than incompressible bytes. These runs used incompressible bytes to measure raw write volume and, for Payload Size, JSON that compresses about 3.4 times, like real documents.
- Warm a new database server past its first checkpoints. Until then it creates its log files rather than reusing them, and a saturated run’s first minutes measured ~8% lower (Minute by Minute).
- Record the round trip beside every throughput number, and compare runs only within one instance: placement within a zone varies the round trip.
- Check each instance before trusting its numbers, on two counts. A slow instance does not look busier.
- Its CPU per step: divide the database’s CPU (cores busy × 1,000) by the steps/s, over the measurement window alone; an average that takes in a warmup or an idle minute reads low. The two 32 vCPU instances here spent 1.03 and 1.26 ms per step.
- Its disk: time single-row commits against
SELECT 1in one session while the database is idle; the difference is its log flush, ~0.4 ms on these. Under load, the window divided by the flushes counted inpg_stat_walgives the flush time: one instance took 1.03 ms where another took 0.82, and ran 22% slower.
- Let a database settle after a restart. Changing some settings restarts it, and for the next minutes every page’s first change is logged whole and its cache is cold: the runs right after a change ran 10–30% low for their first three minutes.
Reproducing
The benchmark host is bench/ in the Dwarf repository.
GOOS=linux GOARCH=arm64 go build -o dwarf-bench ./bench

# Saturated: flows created as fast as a backlog of 2,000 per shard allows.
./dwarf-bench -dsn '1=postgres://USER:PASS@PRIVATE_IP:5432/dwarf?sslmode=disable' \
  -workload linear -payload 0 -open-loop -arrival-rate 0 -concurrency 256 -max-outstanding 2000 \
  -warmup 2m -window 16m -stats-interval 10s -label saturated

# Compressible JSON payloads of about 8 KB per task: -payload 8192 -payload-json
# A fixed offered rate instead (flows/s): -arrival-rate 1000
# More shards: repeat -dsn with 2=..., 3=...; replicas are separate processes on separate hosts.
# Long tasks: -task-delay 8s, or -workload llm -task-delay 60s -concurrency 10000 for closed-loop in-flight.
Use a fresh database for every run (DROP DATABASE ... WITH (FORCE) after killing engines). A killed engine
leaves its replica record behind: a reused database counts it as a live replica for 40 seconds, shrinking the
other replicas’ connection pools, and until the record is pruned, minutes later, it can delay each hand-off of a
shard’s dispatch by about a second.
Next: A Day of Varied Load.